


What is a ‘good cap table’? How have we trained 4,000+ participants on cap tables to date and how can new trainers become masters of cap tables?
Over the coming 12 months we expect to train and certify 30-60 Scale Up Train-the-trainers. These range from accelerator managers, business school faculty, VCs and program managers at large, global entrepreneurship programs. Yet, what they all will face is the joy, the struggle and the complexity of ‘the cap table’.
Here is a short overview on the four most common cap table tools we use in Scale Up!
What is a ‘cap table’?
A capitalization table – or ‘cap table’ – is the living, breathing record of who owns what in your company. It tracks equity ownership across all shareholders, from founders and employees to angels, VCs, and convertible note holders. Think of it as the financial DNA of your startup.
At its core, a cap table shows the percentage ownership, the number of shares, and the type of securities each stakeholder holds. But it is far more than a static spreadsheet. A well-maintained cap table tells the story of your fundraising journey – every investment round, every SAFE conversion, every option grant to key hires. It reveals who has voting rights, who gets paid first in an exit, and how much dilution founders experience as they scale.
In Scale Up!, we have seen hundreds of teams wrestle with their cap tables. The ones who master it early gain a strategic advantage. The ones who treat it as an afterthought often face painful surprises down the road – discovering they have given away too much, structured deals poorly, or created complex messes that scare off sophisticated investors.
Why good cap table management matters?
Poor cap table management is one of the silent killers of startups. We have watched promising companies stumble not because their product failed or their market disappeared, but because their cap table became an unsolvable puzzle.
First, investors care deeply about cap table cleanliness. A messy cap table signals operational immaturity. When a Series A investor sees dozens of small angel investments, confusing SAFE terms, or founder equity splits that don’t make sense, they start asking harder questions. Some walk away entirely. In fact, based on our work with VCs across three continents, cap table issues rank among the top five deal-breakers in early-stage investments.
Second, cap table mistakes compound over time. That generous equity grant to your first employee? That SAFE with a low valuation cap? These decisions ripple through every subsequent round, affecting dilution, control, and exit economics. We have seen founding teams who, after three rounds of funding, own less than 20% of their company – leaving little incentive to keep building.
Third, transparency matters. A well-managed cap table builds trust with your team and investors. Everyone knows where they stand. Employees can model their option value. Investors can track their returns. Founders can make informed decisions about future raises. When we run Scale Up! sessions, the teams that maintain real-time cap table accuracy consistently outperform those who don’t – they make faster decisions, spot problems earlier, and negotiate better terms.
Finally, your cap table becomes critical during exits. Whether it is an acquisition, IPO, or secondary sale, the cap table determines who gets what. Liquidation preferences, anti-dilution clauses, and participation rights all flow from your cap table structure. Get it right, and everyone celebrates. Get it wrong, and you will watch your team’s wealth evaporate in legal fees and disputes.

What role does the cap table have in Scale Up?
In Scale Up!, the cap table isn’t just a teaching tool – it is the backbone of the entire learning experience. Everything flows through it. Every strategic decision participants make, from hiring key talent to choosing between investor offers, ultimately shows up in their cap table.
We designed Scale Up! around a simple truth: you cannot understand startup growth without understanding equity dynamics. Founders face constant trade-offs. Should they take money from that eager angel at a lower valuation, or wait for a lead investor? Should they grant 2% equity to a rockstar COO, or offer a lower package with more cash? Should they raise a large round at a high valuation, or stay lean and bootstrap longer? These questions all converge on the cap table.
Throughout the simulation, teams watch their cap table evolve in real-time. They see how their ownership percentage shrinks with each round. They feel the tension between growth capital and dilution. They experience the consequences of poor terms or ill-timed rounds. And crucially, they develop an intuition for what ‘good’ looks like – balanced ownership, clean structure, alignment with investors.
The cap table also serves as our primary performance tracking mechanism. In our leaderboard, we don’t just track revenue or valuation. We track how efficiently teams deploy capital, how well they preserve equity, and how smartly they structure their deals. The winning teams aren’t necessarily those who raise the most money – they’re the ones who reach their milestones with the least dilution.
From our experience training over 4,000 participants across accelerators, business schools, and VC programs worldwide, we have seen that mastering the cap table transforms how founders think about their business. They stop seeing fundraising as simply getting cash in the door. Instead, they start thinking strategically about capital as a tool, equity as a finite resource, and investors as long-term partners. That mindset shift is what Scale Up! is really about – and the cap table is where it happens.
Here are the four cap tables we use in Scale Up!
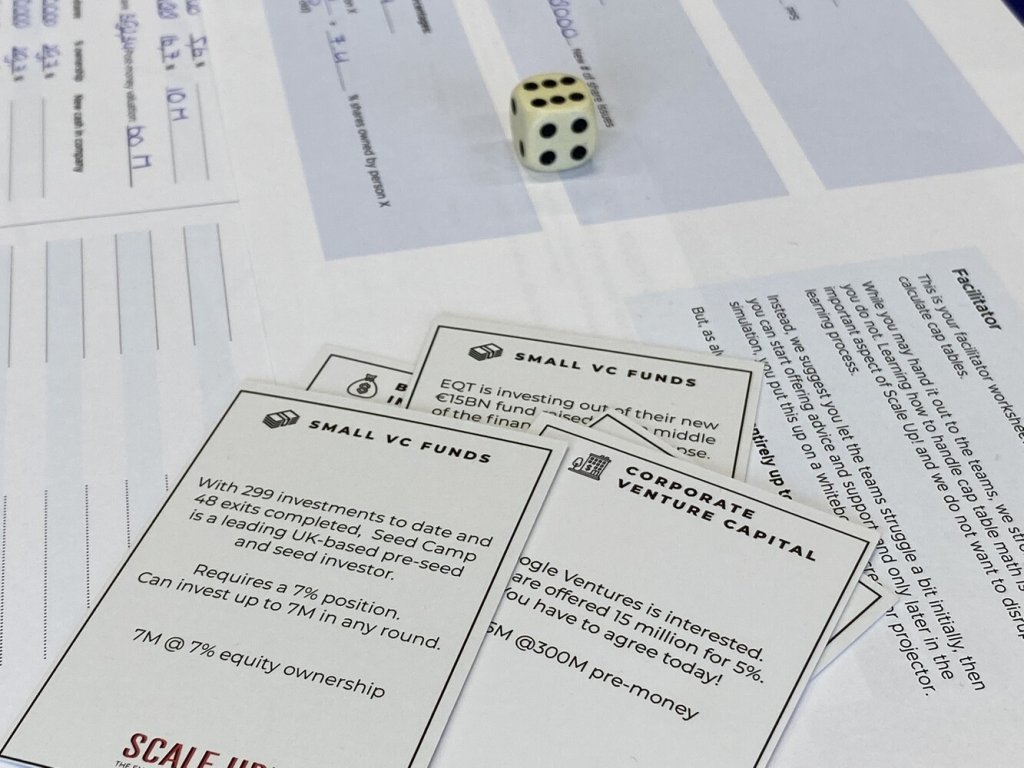
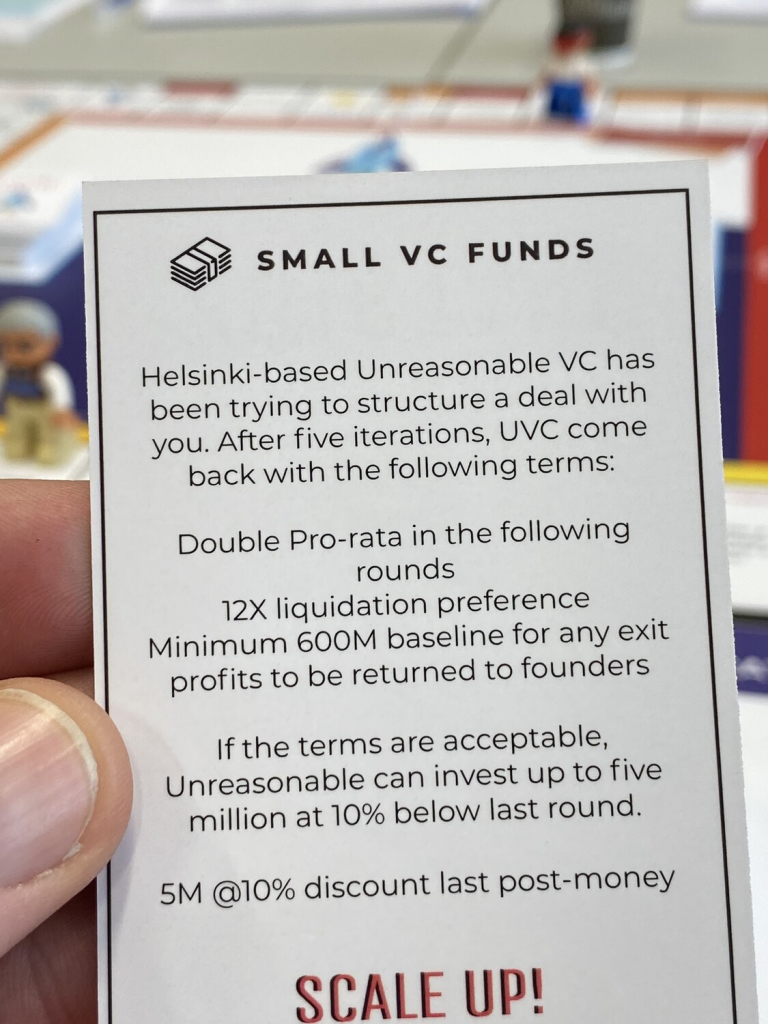
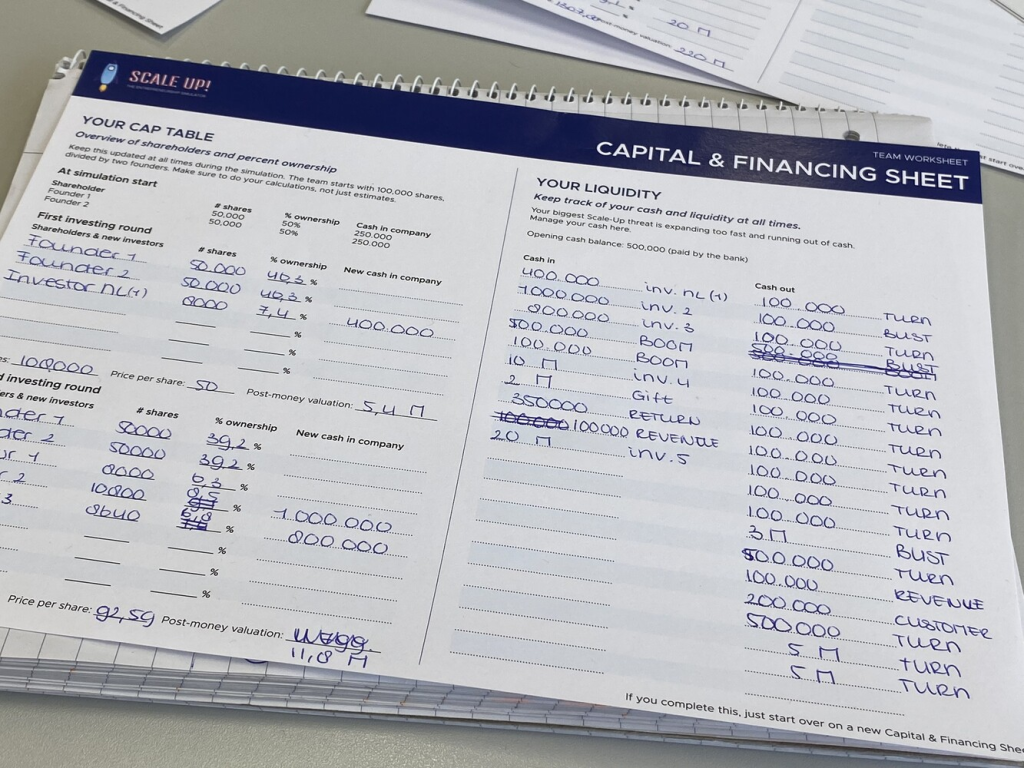
Pen & Paper
For smaller groups, with less experience and less time, the good ol’ pen & paper format works perfectly fine. If you are running a discovery session (3 hours) or even a full-day session, you can get far with just pen and paper.
In fact, Scale Up! was first designed for pen & paper, in the view that we learn more when seeing and writing vs. punching numbers into a spreadsheet. There is something powerful about physically writing down each equity transaction. It forces teams to slow down, discuss each decision, and truly understand what is happening to their ownership structure.
Pro:
– Easy to use – Very easy to get started – Simple to manage for both participants and facilitators – Forces intentional, slower decision-making – Great for building foundational understanding
Con:
– Gets complex after first three rounds – Converting SAFEs and CLAs is not so easy in the paper format – More manual, so it takes a lot longer – Hard to track multiple scenarios or run sensitivity analysis
When to use it:
For small groups, lower levels of pre-existing knowledge, limited time, or when introducing basic cap table concepts for the first time.
Who’s in charge:
The team. Make sure the whole team works through this format together. Go slow. Cover the basics. This collaborative approach ensures everyone understands the fundamentals before moving to more complex tools.
Facilitator view:
With small groups, it’s pretty easy to follow. You can always see the documents and paper records on the table. Increase the group size, say, to six or ten teams and it might get a bit trickier. Budget extra time for teams to catch up, and expect to do more hands-on support walking around the room. We typically recommend one facilitator per 15-20 participants when using pen & paper.
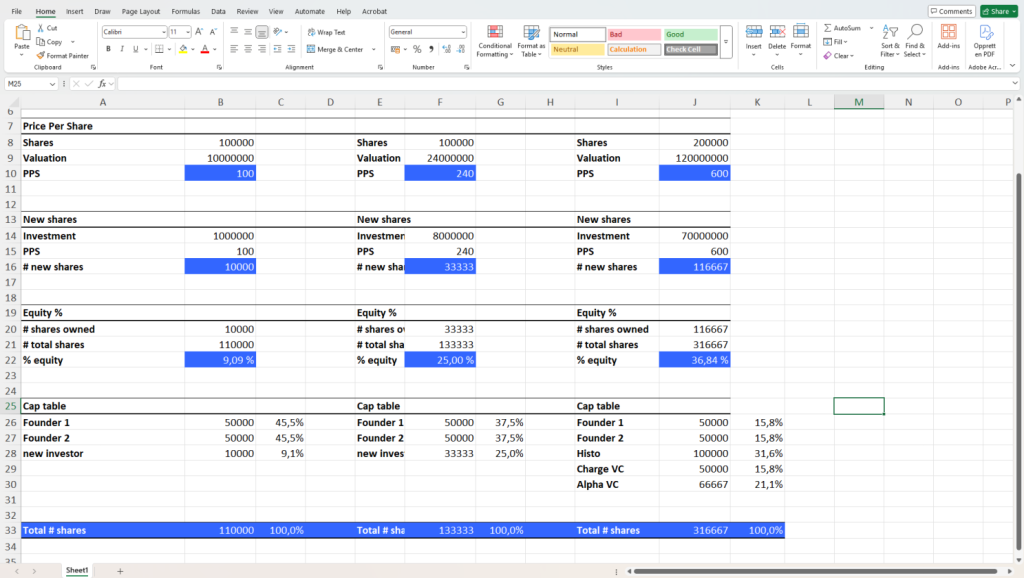
Excel 1.0 (the classic)
Almost as old as the pen & paper format in Scale Up!, the old Excel file is still fantastic to use. It was made for ‘save a local copy’, and has no cloud collaboration or shared leaderboard. It works. It’s simple, but it is also lacking a number of key features.
This version emerged from our early days working with accelerators who wanted something more scalable than paper, but didn’t yet need real-time tracking. It has proven remarkably durable – thousands of founders still use it today.
Pro:
– Easy to use – Covers basic cap table management, nothing else – People use it locally, can take it home and work on it overnight – No internet dependency – Teams can experiment without worrying about ‘breaking’ a shared file
Con:
– Facilitators have little to no insight into how it is going – Hard to follow and impossible to track the top performers – Mistakes are often left unsolved, due to only having local version – No real-time feedback or comparison with peers
When to use it:
Designed to make the pen & paper version slightly more suited for multiple rounds and later stages, it is simple and easy to use. The Excel 1.0 cap table tool is very suitable for small and large groups, at entry- and intermediate levels. Just don’t expect to be able to track performance or clean up mistakes in this format. Best for asynchronous work or when participants want to practice independently between sessions.
Who’s in charge:
The CFO
Facilitator view:
We have run 100’s of sessions with this tool, and it just works. Probably the best tool for super early stage founders who are still wrapping their heads around basic equity concepts. The lack of real-time visibility means you will need to schedule regular check-ins and be ready to troubleshoot issues retroactively rather than preventing them in real-time.
Google Sheet 1.0 (the basic)
A couple of years ago we started experimenting with a shared version, where we could track all teams in the same interface, and also teams could compare themselves in real-time.
We simply copied the excel version into a Google Sheet version (1.0), and voila, we had the basic version. Instantly, this was a hit with participants. The competitive element that emerged from the live leaderboard completely changed the energy in the room. Teams started benchmarking themselves, learning from top performers, and pushing themselves harder.
Pro:
– Same ease of use as Excel – Now in a shared format, with leaderboard – Easy to keep track of all teams, audit and correct cap math mistakes in real-time – Creates healthy competition and peer learning – Facilitators can provide targeted support based on what they see
Con:
– Not many; but a clear message that ‘this is only looking at financing’ – Not tracking ARR, revenue or basic accounting – Teams sometimes focus too much on leaderboard position vs. learning
When to use it:
In most sessions, really. Great for both entry, intermediate and more advanced users. If you have reliable internet and want to create a dynamic, competitive learning environment, this is your go-to tool.
Who’s in charge:
The CFO
Facilitator view:
Bringing the cap table from local Excel to shared Sheet is a game-changer. If there are two facilitators, one would spend ca. 10% of his / her time to just keep an eye on, do light audits and generally correct mistakes before they turned into major problems. The real-time visibility means you can spot patterns – which teams consistently make similar mistakes, which concepts need more explanation, which teams are ready for advanced challenges.
But, the feedback was clear; ‘where do we track everything else….?’ Teams wanted to see how their cap table decisions connected to their revenue growth, hiring plans, and burn rate. That insight led us to build version 2.0.
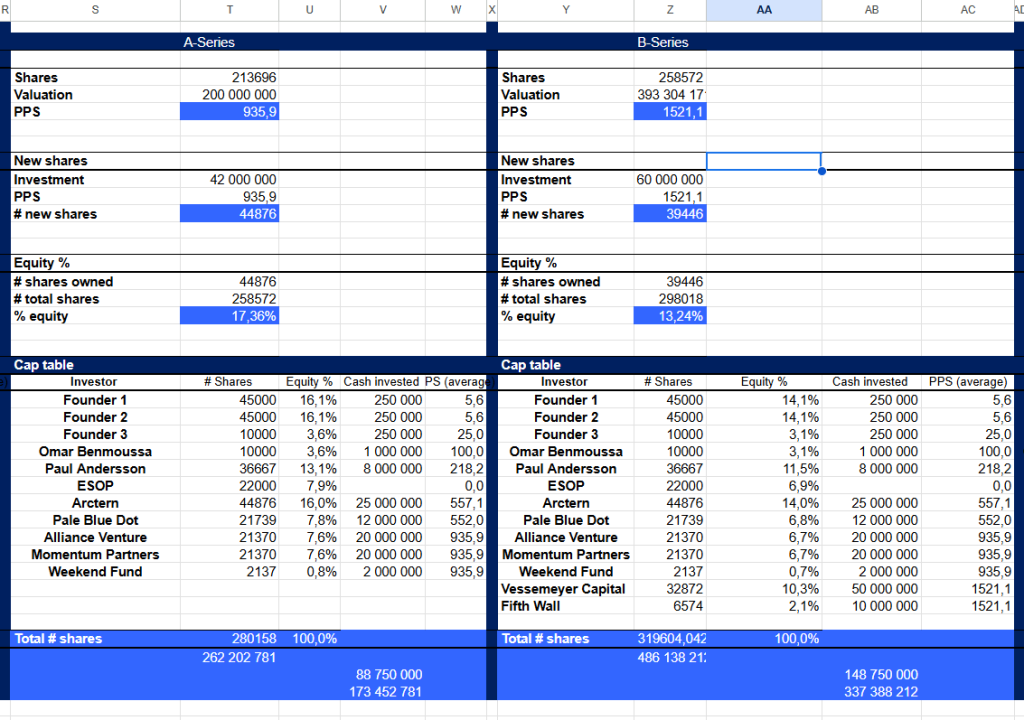
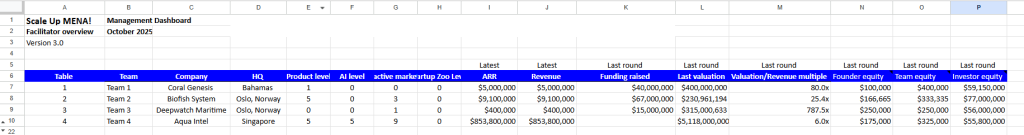
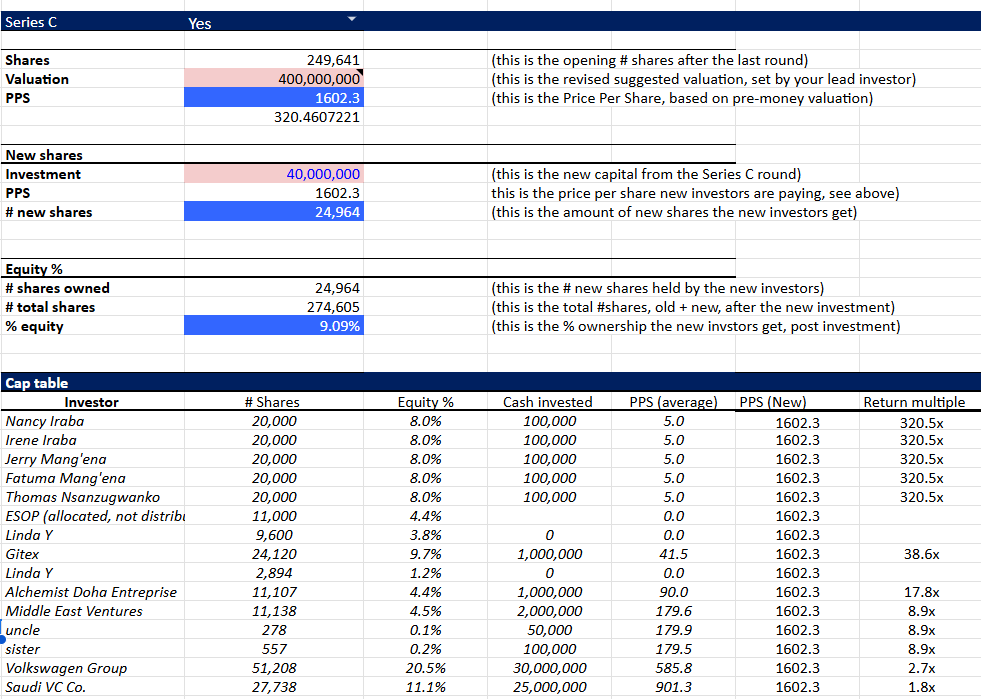
Google Sheet 2.0 (the full management dashboard)
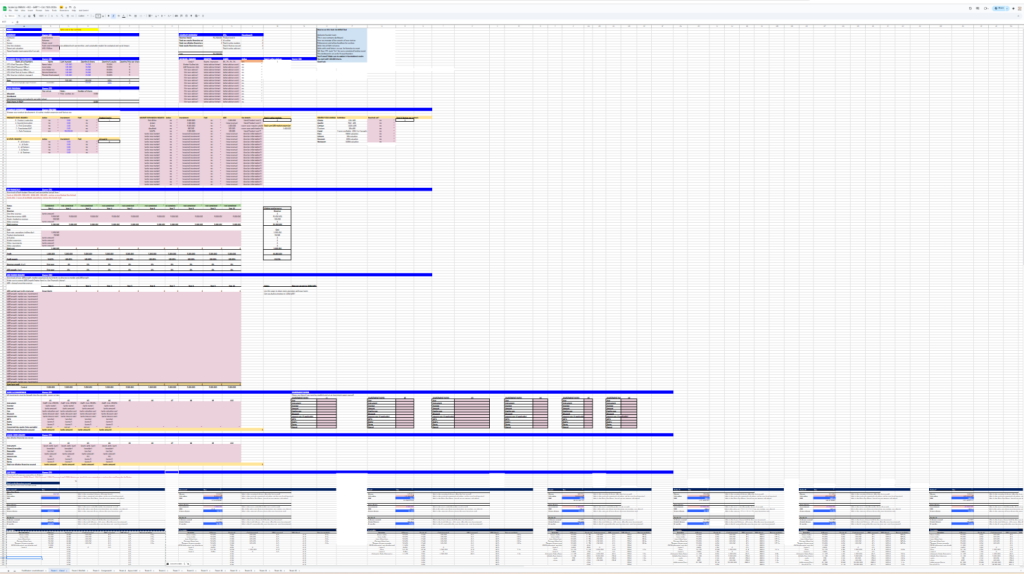
In early 2025 we started piloting a more advanced, full scale ‘Management Dashboard’. This tool would quickly outgrow the cap table, and suddenly teams would be able to run full-scale operations, annual accounting, ARR growth, margins, Y-o-Y growth, advisors, zoo animals and exit transactions, all in the same real-time spreadsheet.
Once we saw this live, we knew we were not going back. This version represents the full Scale Up! experience – where financial strategy, operational decisions, and equity management all interconnect. Teams finally see the complete picture: how hiring that expensive VP impacts burn rate, which impacts runway, which impacts when they need to raise, which impacts dilution.
Pro:
– Comprehensive full overview across all aspects of the company – Real-time, shared with running Leaderboard – Makes it superbly easy to run the session as facilitator, offering far more depth into company financials – Reflects real-world complexity that founders actually face – Teams develop holistic strategic thinking, not just cap table mechanics
Con:
– OK, so, it is very complex. It clearly takes time to figure out, and even the best teams get parts of it wrong – It has a lot of moving parts, leaving it hard for the teams to focus on the core, cap table management – Not for beginners, as most get overwhelmed and do not understand the basic financials, never mind cap tables – Requires significantly more facilitator expertise to run well – Teams need strong collaboration and clear role division to manage effectively
When to use it:
Intermediate and advanced-level teams. Need more time. Only worth using when we have minimum one full day, preferably three days. Best for cohorts that already understand startup basics and are ready to wrestle with the messy reality of scaling a company.
Last used with:
Katapult Ocean Program, and here it worked very well. These were experienced impact-driven founders who needed to see how sustainability metrics, investor expectations, and financial performance all connected. The complexity matched their reality.
Who’s in charge:
The CFO, but all team members have dedicated working areas they own. The CEO focuses on strategy and investor relations, the CTO manages product development costs and technical hiring, the CMO tracks customer acquisition and revenue growth. This distributed ownership mirrors how real startup teams actually operate.
Facilitator view:
This is a monster to run, but once it is running it is fantastic. Due to the holistic view on each startup, the full management dashboard takes the Scale Up! experience to another level – but only if you as a facilitator can handle it. You need deep financial literacy, strong group facilitation skills, and the ability to rapidly diagnose where teams are stuck. Plan for at least two facilitators for groups larger than 20 participants. The upside? Teams leave with genuine strategic capabilities that transfer directly to their real companies.
Closing thoughts
With 30-60 new trainers coming online, there will be plenty of chances for Scale Up sessions, big and small. From classrooms to Masterclasses, we will be delivering Scale Up!, Scale Up MENA! and Scale Up Africa Rising!
But, keeping track of all things cap tables is crucial. As a future facilitator, make sure you select the cap table tool that works for you and master it. Use this guide to decide on the right tool for the job for you.
Remember: the tool itself matters far less than your ability to use it effectively. We have seen brilliant sessions run with pen & paper, and mediocre ones with the full dashboard. Your job as a facilitator is to meet participants where they are, push them appropriately, and ensure they leave understanding not just how to fill out a cap table, but why it matters.
Start simple. Master one tool completely before moving to the next. Build your confidence. And most importantly, remember that behind every cap table percentage is a real founder making real decisions about their company’s future. Our job is to help them make those decisions wisely.